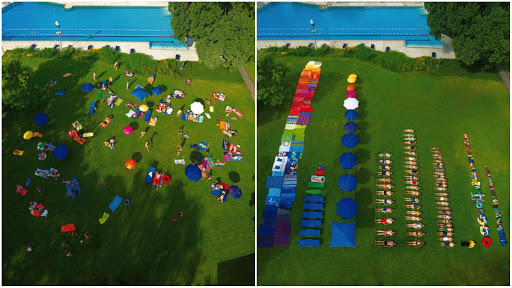
[vc_row type=”in_container” full_screen_row_position=”middle” column_margin=”default” scene_position=”center” text_color=”dark” text_align=”left” overlay_strength=”0.3″ shape_divider_position=”bottom” bg_image_animation=”none”][vc_column column_padding=”no-extra-padding” column_padding_position=”all” background_color_opacity=”1″ background_hover_color_opacity=”1″ column_link_target=”_self” column_shadow=”none” column_border_radius=”none” width=”1/1″ tablet_width_inherit=”default” tablet_text_alignment=”default” phone_text_alignment=”default” overlay_strength=”0.3″ column_border_width=”none” column_border_style=”solid” bg_image_animation=”none”][vc_raw_html]JTNDZGl2JTIwc3R5bGUlM0QlMjJtYXgtd2lkdGglM0ExMDAlMjUlMjIlM0UlM0NkaXYlMjBzdHlsZSUzRCUyMnBvc2l0aW9uJTNBcmVsYXRpdmUlM0JoZWlnaHQlM0EwJTNCcGFkZGluZy1ib3R0b20lM0E1Ni4yNSUyNSUyMiUzRSUzQ2lmcmFtZSUyMHNyYyUzRCUyMmh0dHBzJTNBJTJGJTJGZW1iZWQudGVkLmNvbSUyRnRhbGtzJTJGdXJzdXNfd2VocmxpX3RpZHlpbmdfdXBfYXJ0JTIyJTIwd2lkdGglM0QlMjI4NTQlMjIlMjBoZWlnaHQlM0QlMjI0ODAlMjIlMjBzdHlsZSUzRCUyMnBvc2l0aW9uJTNBYWJzb2x1dGUlM0JsZWZ0JTNBMCUzQnRvcCUzQTAlM0J3aWR0aCUzQTEwMCUyNSUzQmhlaWdodCUzQTEwMCUyNSUyMiUyMGZyYW1lYm9yZGVyJTNEJTIyMCUyMiUyMHNjcm9sbGluZyUzRCUyMm5vJTIyJTIwYWxsb3dmdWxsc2NyZWVuJTNFJTNDJTJGaWZyYW1lJTNFJTNDJTJGZGl2JTNFJTNDJTJGZGl2JTNF[/vc_raw_html][/vc_column][/vc_row][vc_row type=”in_container” full_screen_row_position=”middle” column_margin=”default” scene_position=”center” text_color=”dark” text_align=”left” overlay_strength=”0.3″ shape_divider_position=”bottom” bg_image_animation=”none”][vc_column column_padding=”no-extra-padding” column_padding_position=”all” background_color_opacity=”1″ background_hover_color_opacity=”1″ column_link_target=”_self” column_shadow=”none” column_border_radius=”none” width=”1/1″ tablet_width_inherit=”default” tablet_text_alignment=”default” phone_text_alignment=”default” overlay_strength=”0.3″ column_border_width=”none” column_border_style=”solid” bg_image_animation=”none”][vc_column_text]We staan pas aan het begin van de golf van related en relevant content op basis van gedrag en interesses. En, hoe relevant services ook zijn, we kunnen ook te ver gaan. Ursus Wehrli’s “Tidying up art” is niet alleen erg grappig, maar bracht voor mij ook een mooie boodschap over het relativeren van alle mogelijkheden van statistieken en recommendation engines, wanneer hij Keith Haring op de hak neemt:[/vc_column_text][/vc_column][/vc_row][vc_row type=”in_container” full_screen_row_position=”middle” column_margin=”default” scene_position=”center” text_color=”dark” text_align=”left” overlay_strength=”0.3″ shape_divider_position=”bottom” bg_image_animation=”none”][vc_column column_padding=”padding-9-percent” column_padding_position=”all” background_color=”#ffffff” background_color_opacity=”1″ background_hover_color_opacity=”1″ column_link_target=”_self” column_shadow=”medium_depth” column_border_radius=”none” width=”1/1″ tablet_width_inherit=”default” tablet_text_alignment=”default” phone_text_alignment=”default” overlay_strength=”0.3″ column_border_width=”none” column_border_style=”solid” bg_image_animation=”none”][vc_column_text]”This is Keith Haring looked at statistically.
One can see here quite clearly, you can see we have 25 pale green elements, of which one is in the form of a circle. Or here, for example, we have 27 pink squares with only one pink curve.
I mean, that’s interesting. One could extend this sort of statistical analysis to cover all Mr. Haring’s various works.
In order to establish in which period the artist favored pale green circles or pink squares.
And the artist himself could also benefit from this sort of listing procedure by using it to estimate how many pots of paint he’s likely to need in the future.
One can obviously also make combinations.
For example, with the Keith Haring circles and Kandinsky’s dots. You can add them to all the squares of Paul Klee.
In the end, one has a list with which one then can arrange.
Then you categorize it, then you file it, put that file in a filing cabinet, put it in your office and you can make a living doing it.”[/vc_column_text][/vc_column][/vc_row][vc_row type=”in_container” full_screen_row_position=”middle” column_margin=”default” scene_position=”center” text_color=”dark” text_align=”left” overlay_strength=”0.3″ shape_divider_position=”bottom” bg_image_animation=”none”][vc_column column_padding=”no-extra-padding” column_padding_position=”all” background_color_opacity=”1″ background_hover_color_opacity=”1″ column_link_target=”_self” column_shadow=”none” column_border_radius=”none” width=”1/1″ tablet_width_inherit=”default” tablet_text_alignment=”default” phone_text_alignment=”default” overlay_strength=”0.3″ column_border_width=”none” column_border_style=”solid” bg_image_animation=”none”][vc_column_text]Mocht je overigens nog niet geabonneerd zijn op de TED talks: ga je dan eerst heel erg schamen en abonneer je vervolgens via RSS of Podcast.[/vc_column_text][/vc_column][/vc_row]


1 comment
Poptech blaast ook een potje mee (http://www.poptech.org/)
Ken je Nathan Mhyrvold's TED-praatje?